
Thermal Comfort Design Assessments
Advancing Building Design with Strategic Thermal Comfort Analysis
As a building design professional, the art of explaining thermal comfort is a tricky topic since comfort is a very personal phenomenon and everyone has their own experiences and understands what comfort should be. While there are comfort standards, and in theory there have been for some time, few engineers and architects have time to read these in the myriad of things to pay attention to these days. It is hard to blame them. And while I could debate the science of comfort, what the metrics say, how to understand them, and how solutions then fit those metrics, I find it most compelling to root myself first in the principles of thermal comfort and then find ways to meet project teams where they are at and empower them with strategies for improving and providing levels of control and flexibility for their buildings to adapt the thermal environment.
A few things that have helped me in my journey to support project teams and explore the nuances of thermal comfort are the power of thermal analysis tools and the art of storytelling. As an engineer, I was trained to think linearly and objectively — to quantify, optimize, and pursue perfect solutions. Yet, thermal comfort resists such precision; it can be modeled and measured, but its meaning shifts with each person, place, and moment. Real progress happens when decision makers not only see the data but connect with the story behind it — when they make the idea their own, shaped by their values, beliefs, and sometimes their very human desire to create comfort for others.
So, while you can go and find the thermal comfort standards and a wonderful set of tools for your enjoyment, I wanted to take a moment to share some of what I have found to be resounding thermal comfort fundamental concepts and then a few examples of storytelling methods and the project constraints which we faced.
Thermal Comfort Fundamental Concepts
Hot Glass and Standing in the Sun
Radiant surfaces, to use a physics-based term, are not a new phenomenon though certainly one which is quite important in thermal comfort. As much as we all have experienced standing next to a hot surface, or standing in the shade versus the sun, some part of our brain still associates ‘thermal comfort’ with only the air temperature. Roughly speaking, radiant heat exchange is roughly 50% of total body-environment heat transfer. So, when we consider strategies for buildings, how we control or at least protect thermal surfaces from getting too hot or too cold is critical. Where I get my haircut in a modern retail shop downtown the building has a concrete floor, likely 10” thick, with forced air heating and cooling. Year-round, my hairstylist says the building is cold, always cold. Certainly, it makes a lot of sense to me seeing as it might take 10 hours just to raise the floor a few degrees, yet each night they turn off the heater and come back in the morning.
Down Draft from a Cold Window
Certainly, in older homes and buildings and particularly in cold climates, the draft of cold air that forms and pools around my feet during winter is a well-known chilling experience. While this combines several comfort aspects together the main thing occurring is a difference in comfort across our bodies or asymmetric comfort. Even a few degrees difference from our feet to our neck can cause the body to just be uncomfortable. It might be 72°F or 74°F! in winter and yet, people in certain locations seem to still be cold.
Clothing Levels and Air Movement
While the building physics community only recently in the last few years gained a better ability to quantify and design with ceiling fans and air movement, people I know instinctively understand how when they are too hot, wearing shorts and a T-shirt while standing next to a fan can do wonders for your comfort. The idea of air movement and clothing levels as a flexible or usable tool is often not considered in building design, yet now more than ever it should be. The practical limits of air movement are worth considering, we do not want kids’ papers blowing off their school desks, yet still a modest amount of air movement over versus none can be a powerful way to adapt to people’s levels of comfort.
There are more fun revelations I have experienced yet these stand out as repeat conversations we tend to have to try and break people out of just using air temperature for all things.
Storytelling Methods and Example Constraints
Simplified Terminology for Initial Feedback
Thermal comfort and working through metrics and defining what is good, what is bad, can be a challenging road. Fortunately, there are common words that can transcend any group and serve as good introductions to where there might be problems in building design and what to consider; they are ‘hot, cold, neutral, and everything in between’.
In a large laboratory office building in California the objective for the project was to attract tenants to use the space and ensure leasable floor area. Early in design, driven by both cost and simplicity, the design included a substantial amount of glass facing south as well as west. The team identified hot spots that were likely to both drive discomfort along the perimeter, setting the usable space back 10 to 15 feet, as well as challenges in HVAC, requiring very large systems with high volumes of air.
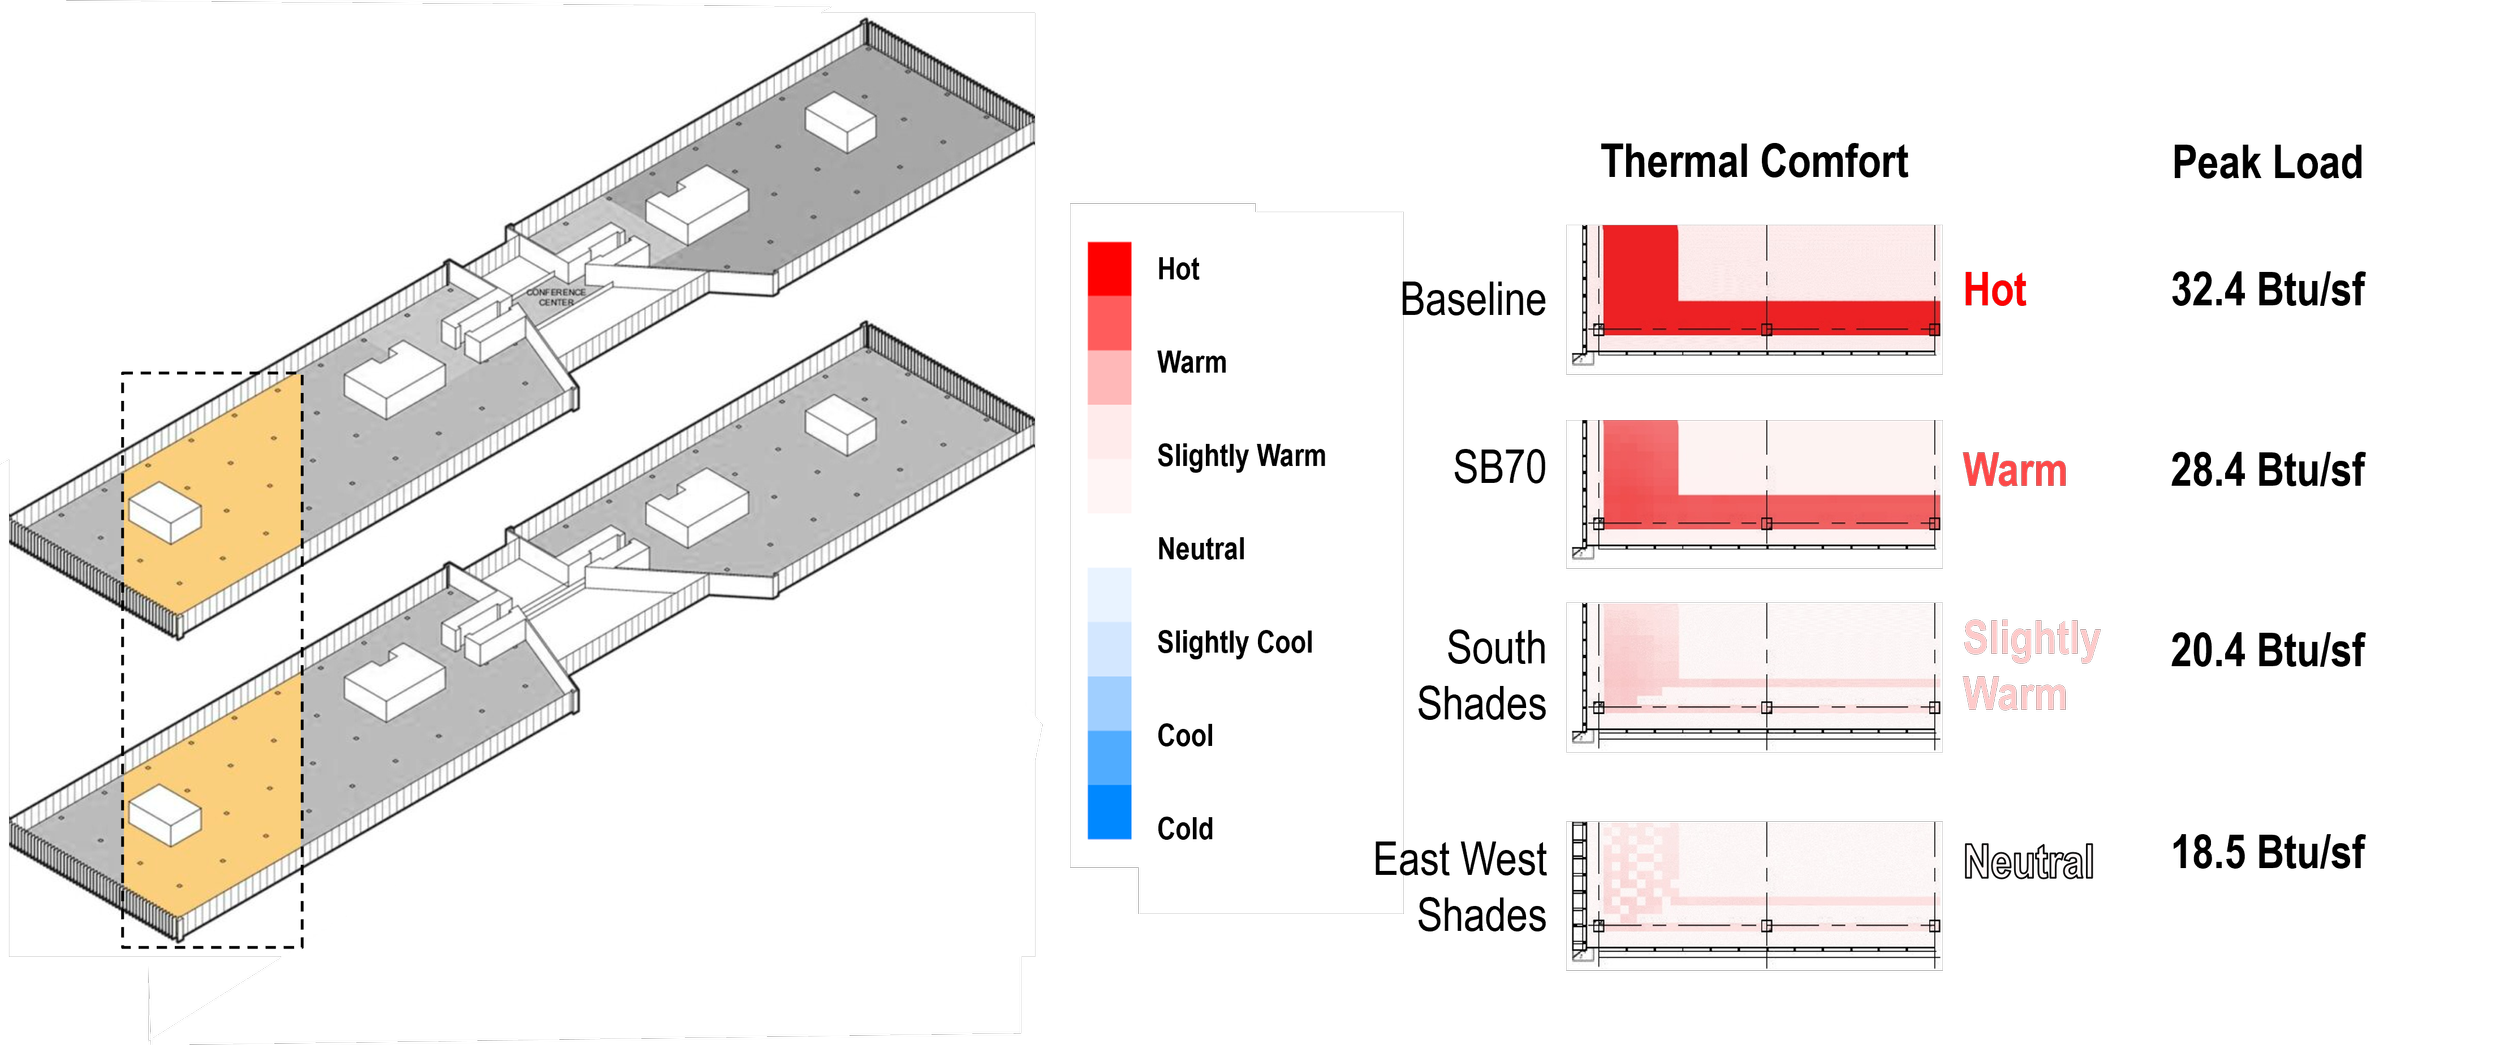
The team evaluated a set number of strategies to bring ideas to the table, changing both the glass type from the design standard and evaluating the impact of shading along façades. While the computation was done based on thermal comfort metrics the final data was shared by labeling the solutions, which resulted in Hot, Warm, and Neutral comfort levels to convey information.
The use of temperature and degrees – air, radiant, or an average of them

We’re conditioned to think of a thermostat, whether at home or in a car, as the ultimate measure of comfort. But in reality, air temperature alone is a poor indicator of how comfortable we feel. Still, it remains powerful as a familiar, intuitive reference point.
True comfort depends not just on the temperature of the air, but also on the temperature of the surrounding surfaces — the walls, windows, and ceiling that radiate heat toward or away from us. When these radiant effects are combined with air temperature, the result is called the operative temperature. Even when simplified as an average between air and surface temperatures, it provides a far more meaningful reflection of how a space actually feels.
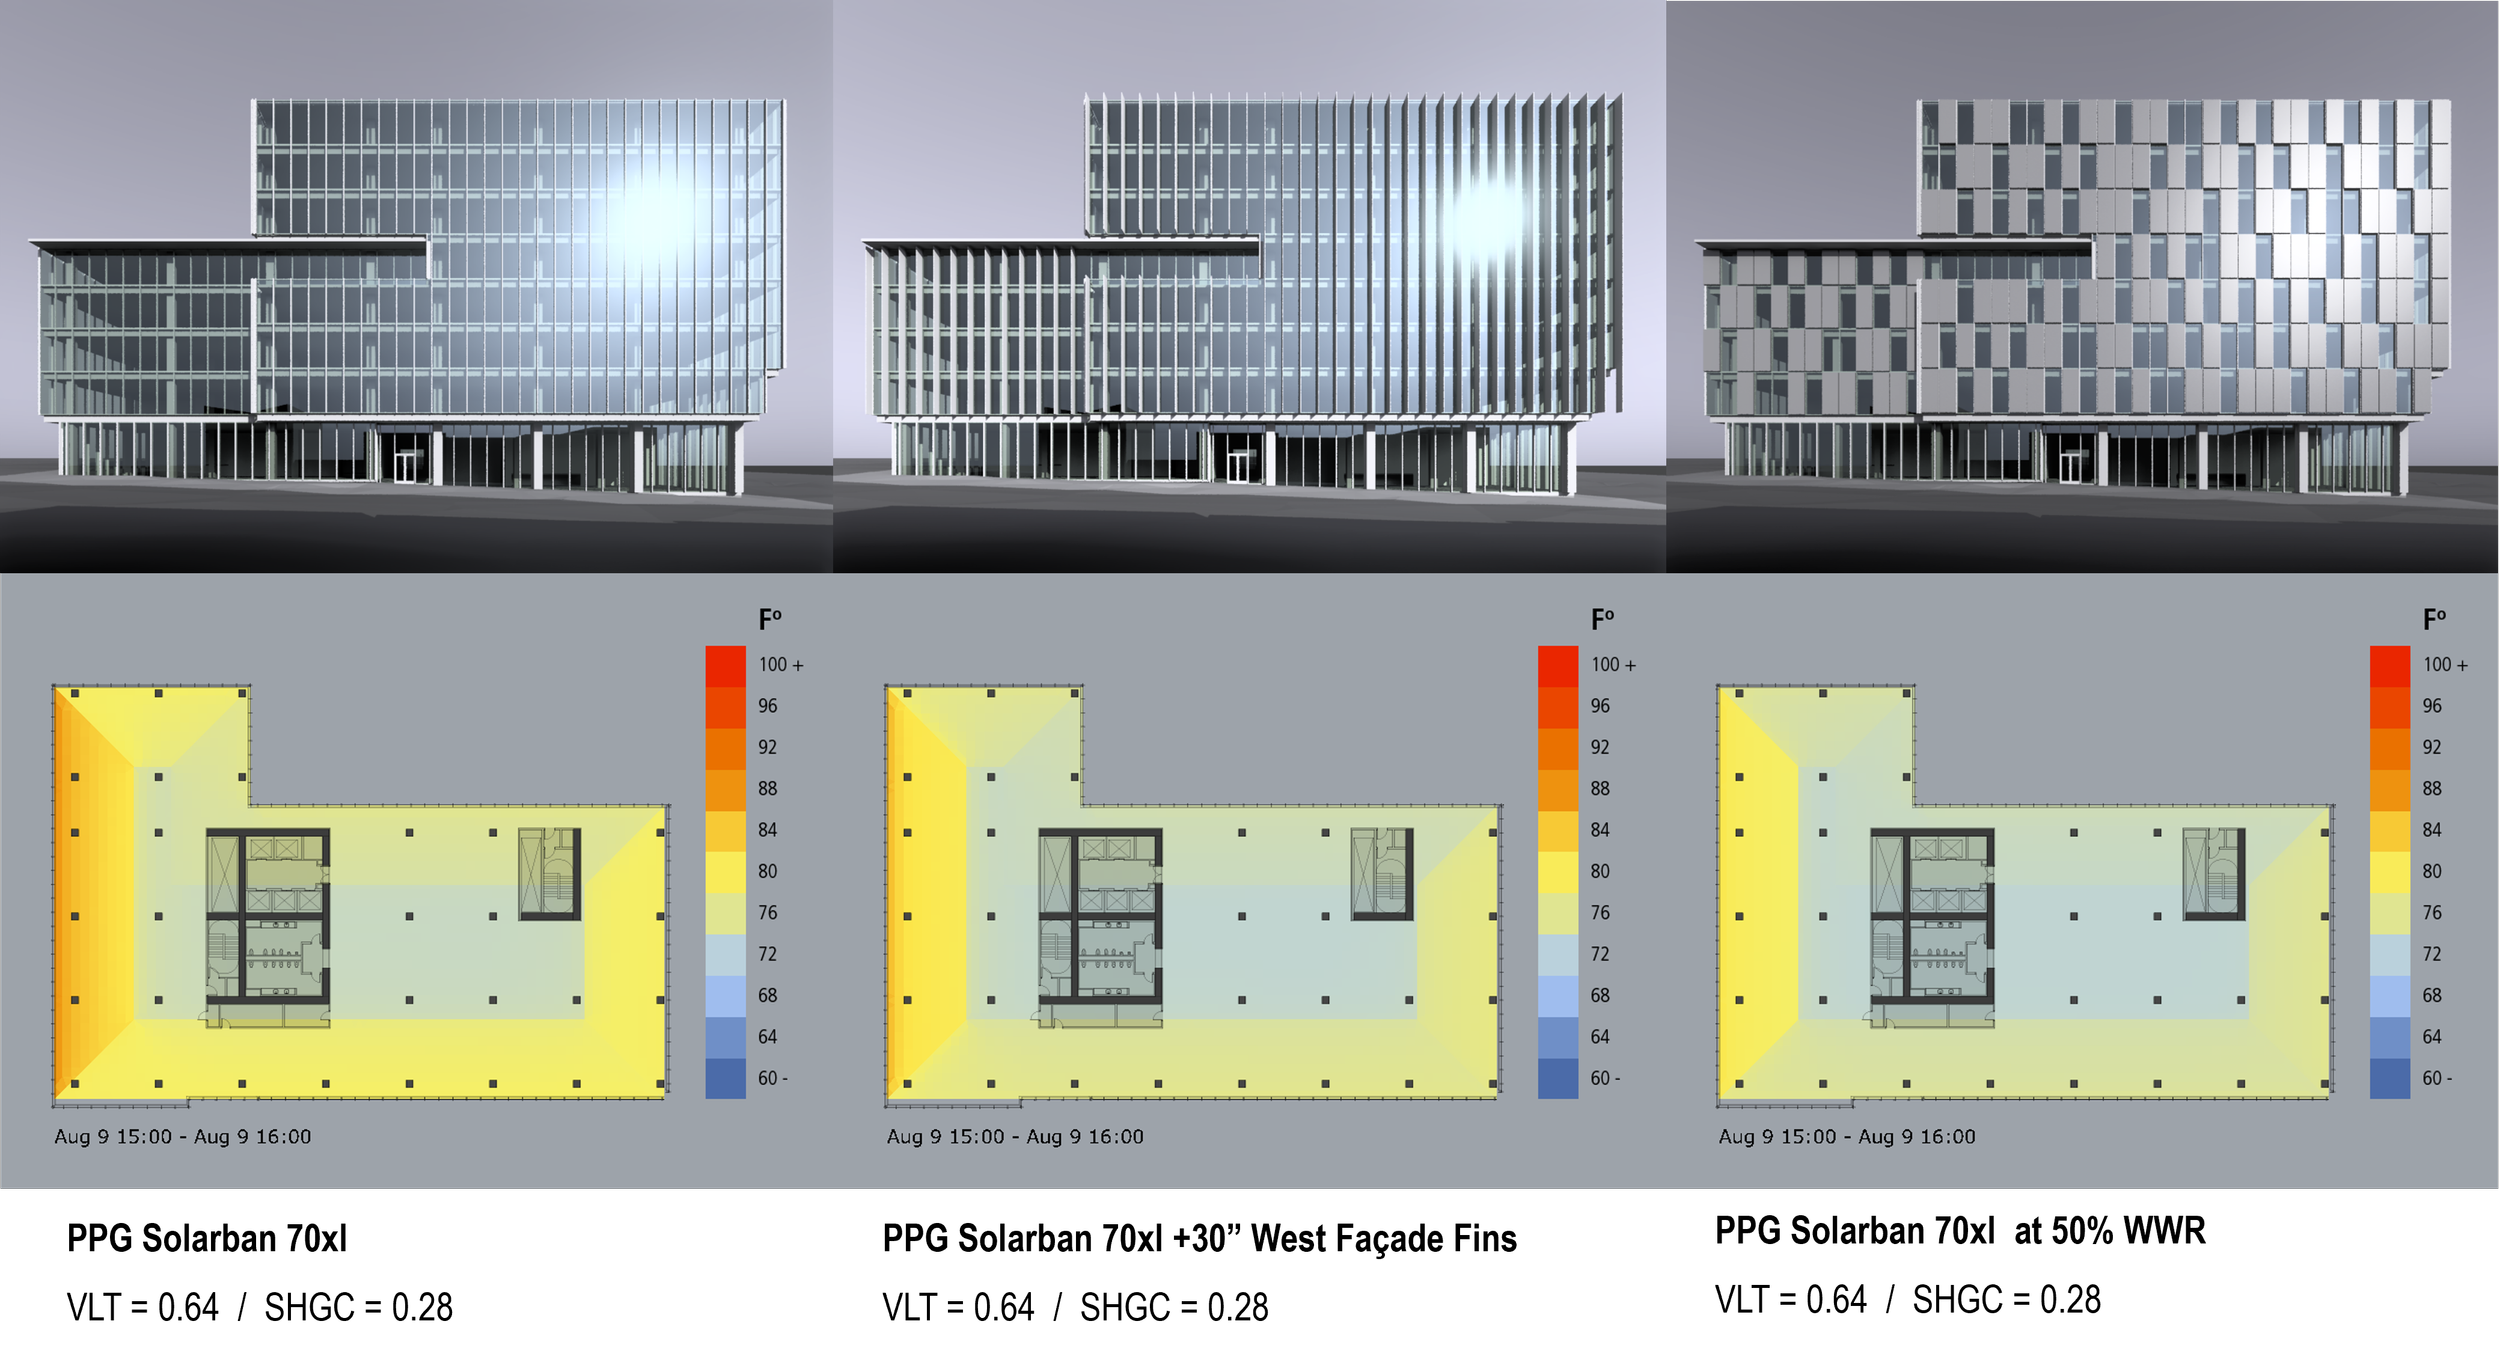
In one project that sought to preserve west-facing views through a large, glazed façade, operative temperature was the only meaningful way to assess comfort. The analysis revealed that, even with full air conditioning, the west-facing zone would be too warm nearly 30% of the time due to solar gains. By improving the glazing performance and adding exterior shading fins, the design team reduced that discomfort to under 10%, while also narrowing the range of extreme temperature swings. The final, less popular but most effective solution — reducing the glazing area — ultimately resolved the issue entirely, underscoring how design choices can shape comfort more profoundly than mechanical systems ever could.
Daily Temperature Range Frequency of Occurrence

While temperature alone can seem like an oversimplified measure of comfort, it remains one of the most effective ways to communicate results to clients, especially when expressed in familiar units like degrees Fahrenheit.
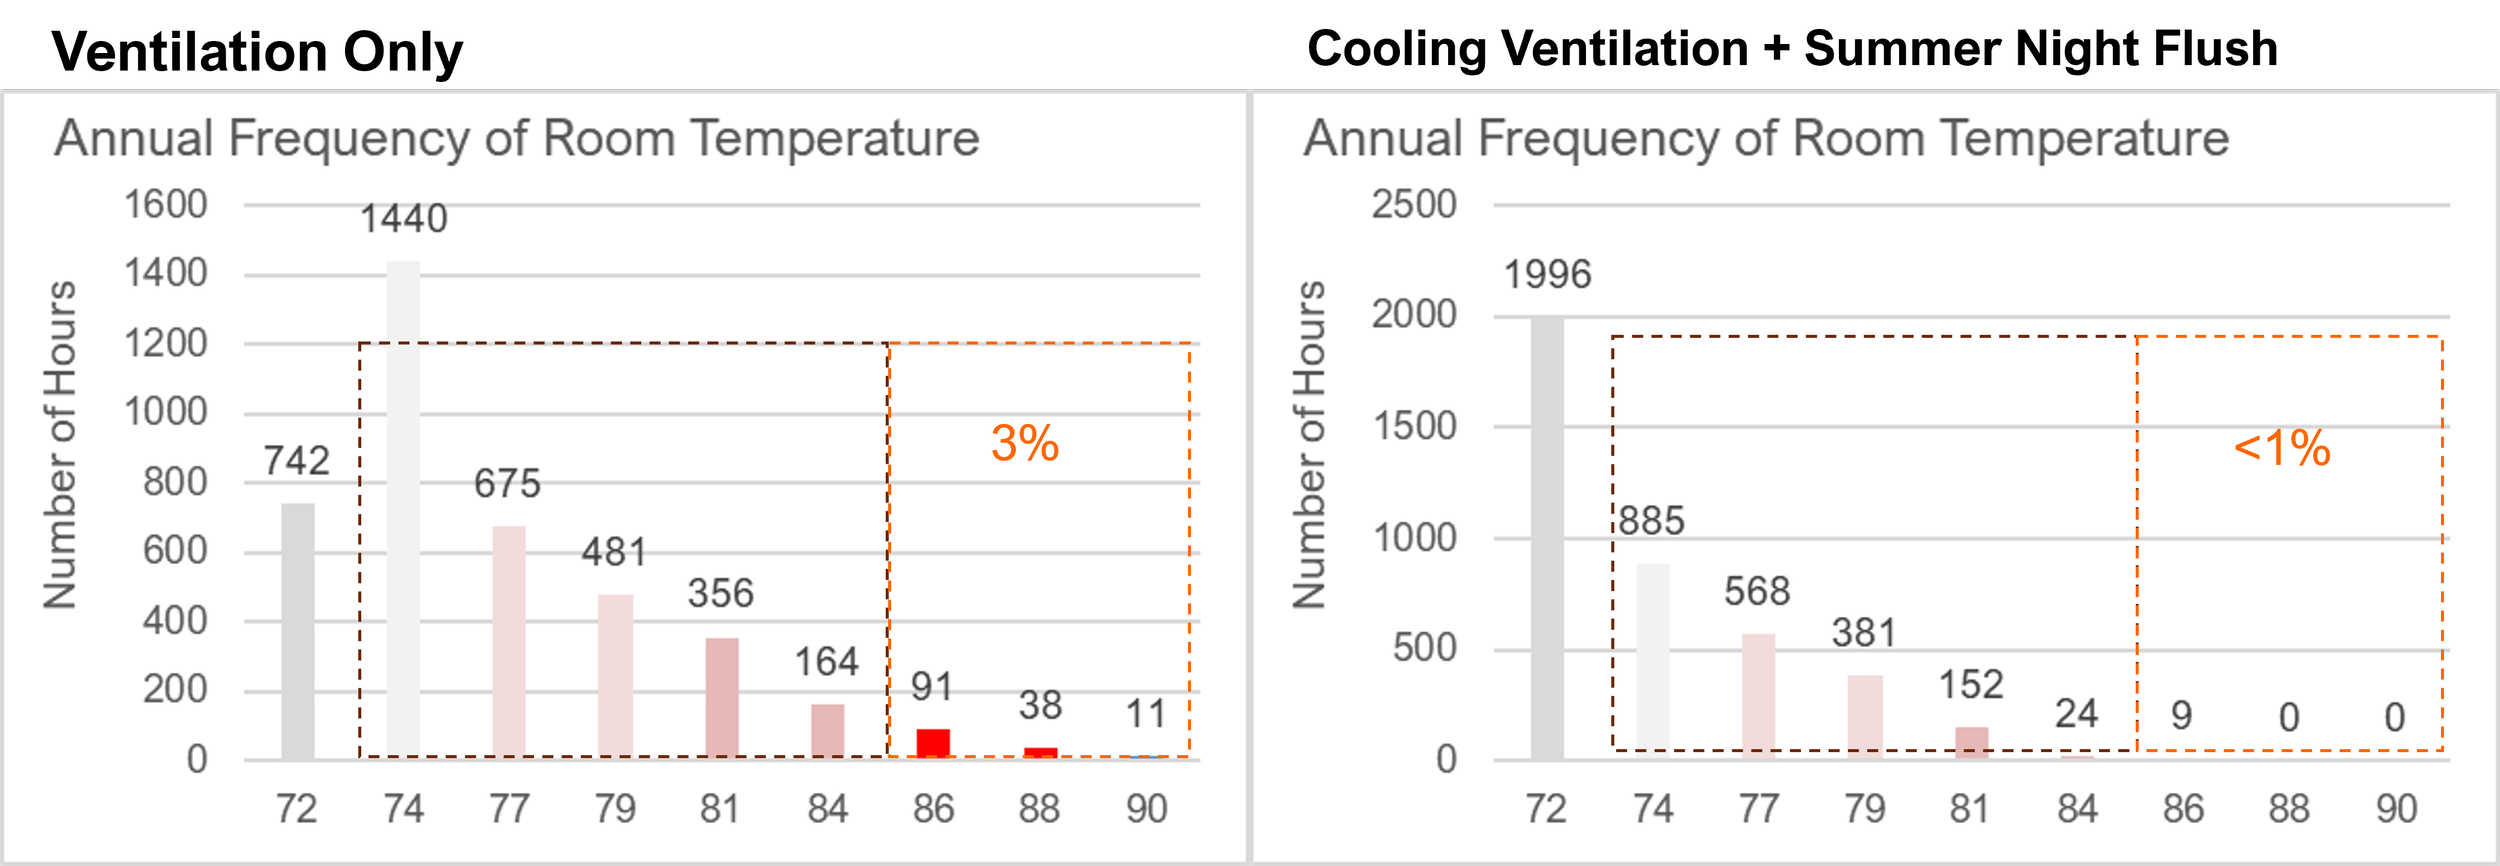
In a recent project evaluating classroom comfort during the renovation of a naturally ventilated building, the team explored whether to add full air conditioning. The project involved an existing library at a private school in the San Francisco Bay Area, originally designed to take advantage of the region’s mild climate through operable windows, high thermal mass, and in-slab radiant heating for passive comfort control.
As part of the renovation, half of the library was being converted into classrooms, and school staff raised concerns about maintaining comfort, requesting that the team assess the potential for adding air conditioning. Using a rapid building energy model, the team evaluated passive cooling options and developed a solution that leveraged the existing ductwork and ventilation airflow, avoiding the need for a full mechanical retrofit.
While the technical analysis involved detailed comfort metrics, psychrometric charts, and model outputs, the conversation that ultimately built understanding and consensus was far simpler: focusing on the number of hours indoor temperatures stayed at or below 80°F. This single, relatable metric bridged the gap between technical insight and intuitive understanding — turning a complex comfort discussion into a clear, actionable decision.
Adaptive Comfort and Thermal Autonomy

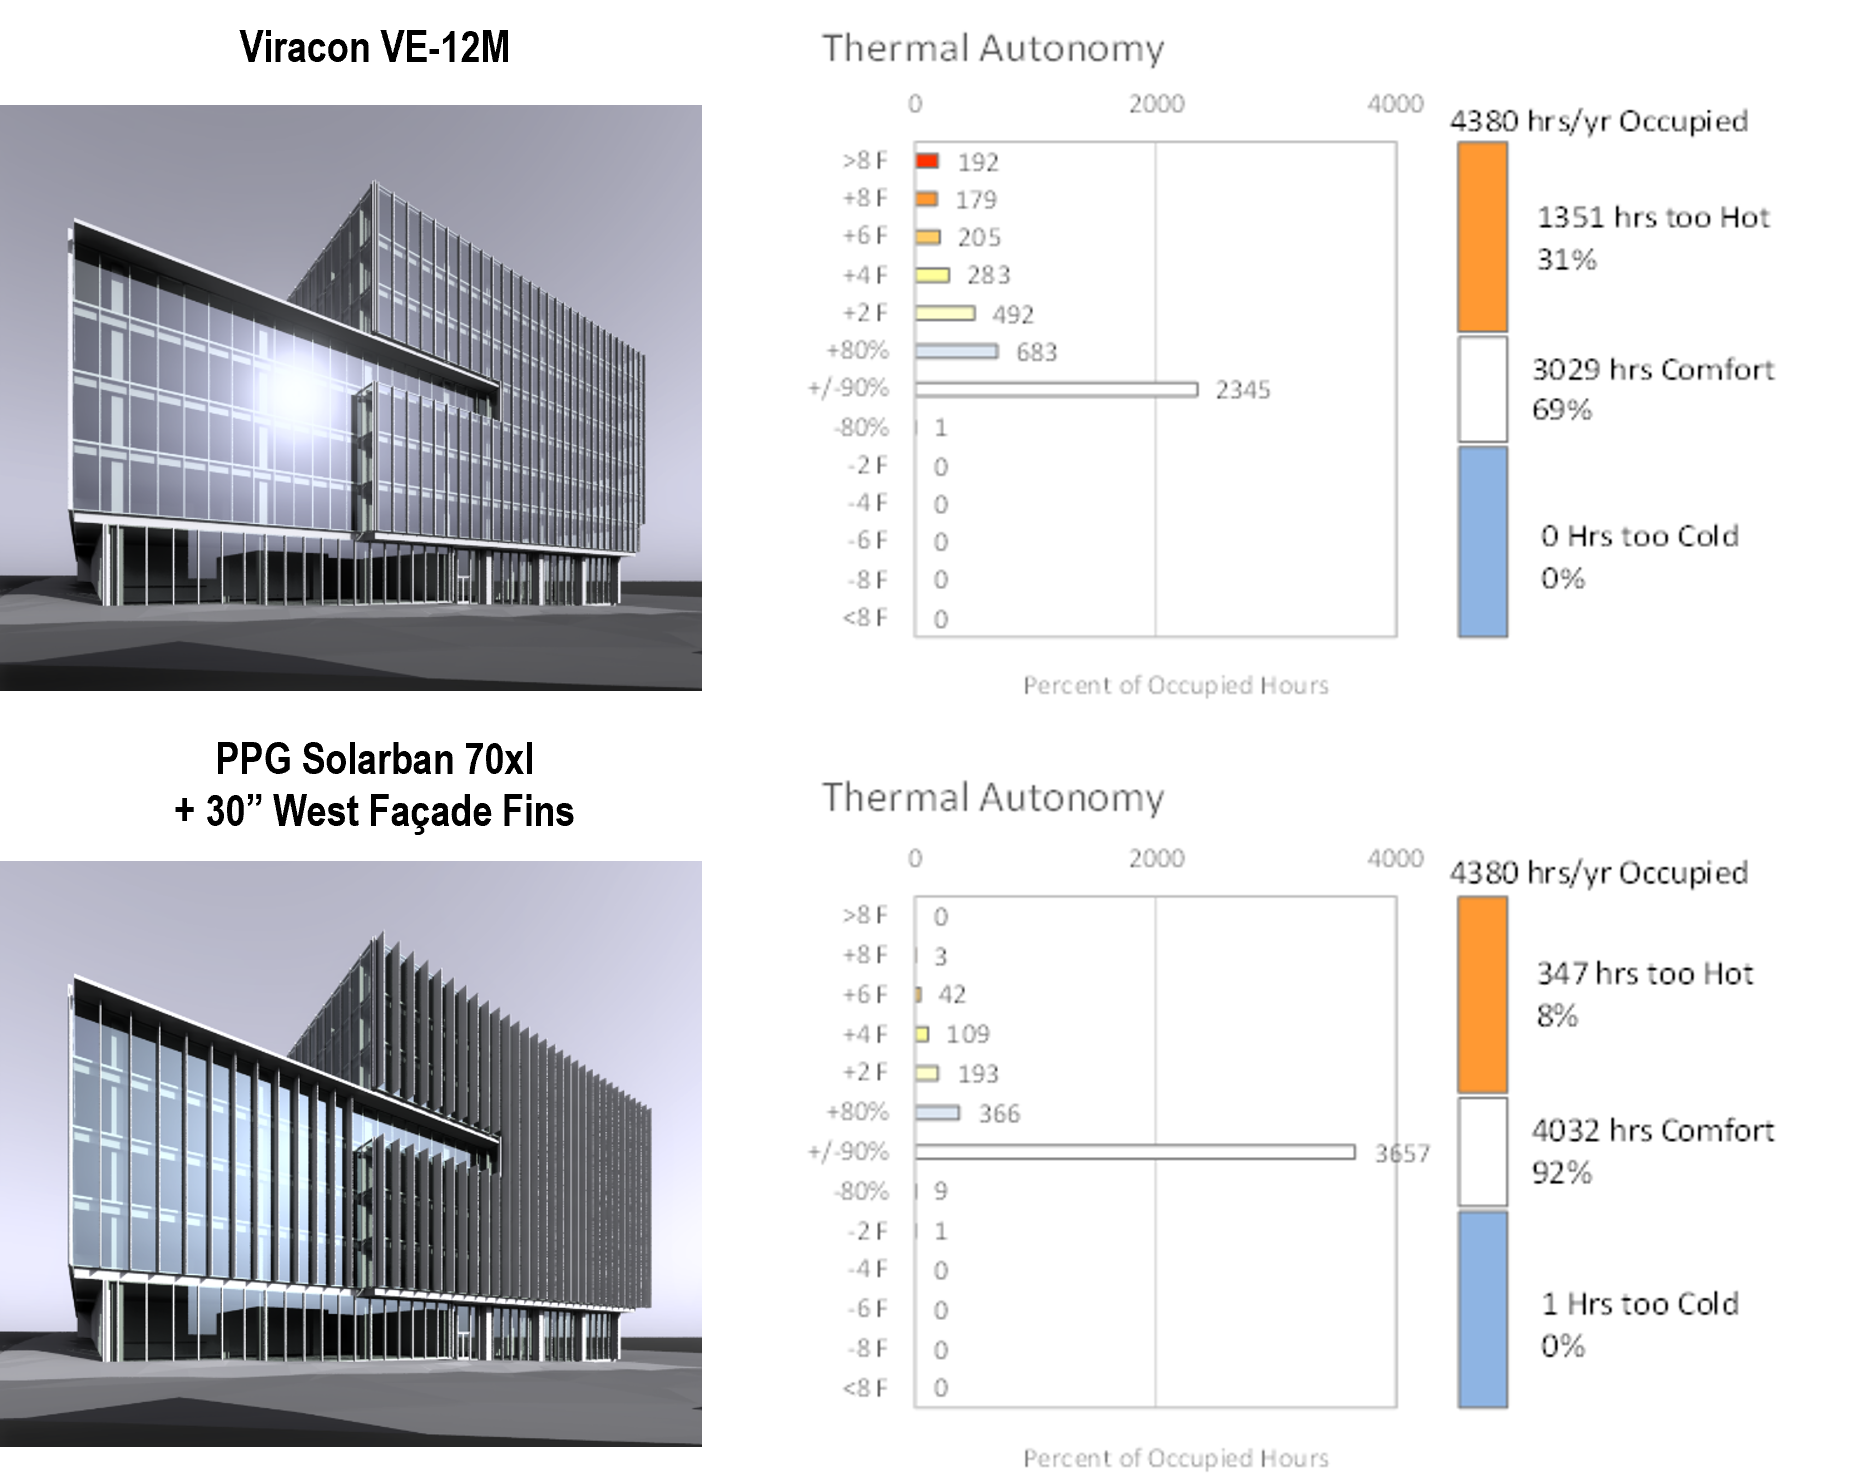
As an engineer and a linear thinker, one of my favorite examples of combining graphical insight with quantitative analysis is the concept of Thermal Autonomy — a metric introduced by Loisos + Ubbelohde (2013). Thermal Autonomy extends the thermal comfort framework established in ASHRAE Standard 55 by quantifying how often a space remains within (or drifts outside) an acceptable comfort range throughout the year.
Rather than simply labeling a space as “comfortable” or “uncomfortable,” the method defines the comfort boundaries — for example, the range that keeps 80% or 90% of occupants satisfied — and then evaluates each hour of the year to determine both how frequently and by how much the space deviates from those limits.
In one study of a west-facing office with nearly full glazing, Thermal Autonomy was used to quantify the impact of improved shading strategies. The analysis revealed that by introducing 30-inch exterior fins and reducing the glazing area, the perimeter zone experienced a dramatic reduction in discomfort, from 1351 hours to hot to 347 hours, less than 10% of the time the building was occupied. Most of the remaining hours fell within a modest +2°F to +4°F above the comfort threshold, demonstrating how effectively small design adjustments can reclaim thermal balance across a year’s worth of conditions.
As designers and engineers, we often model and measure in search of perfect control. Yet thermal comfort reminds us that buildings are not equations but lived experiences — shaped as much by light and surfaces as by data. The true opportunity is to use analysis as a storytelling tool that connects building physics to human experience.